Welcome to the interactive Chart Interpretation test
For a printable question sheet click here.


Welcome to the interactive Chart Interpretation test
For a printable question sheet click here.
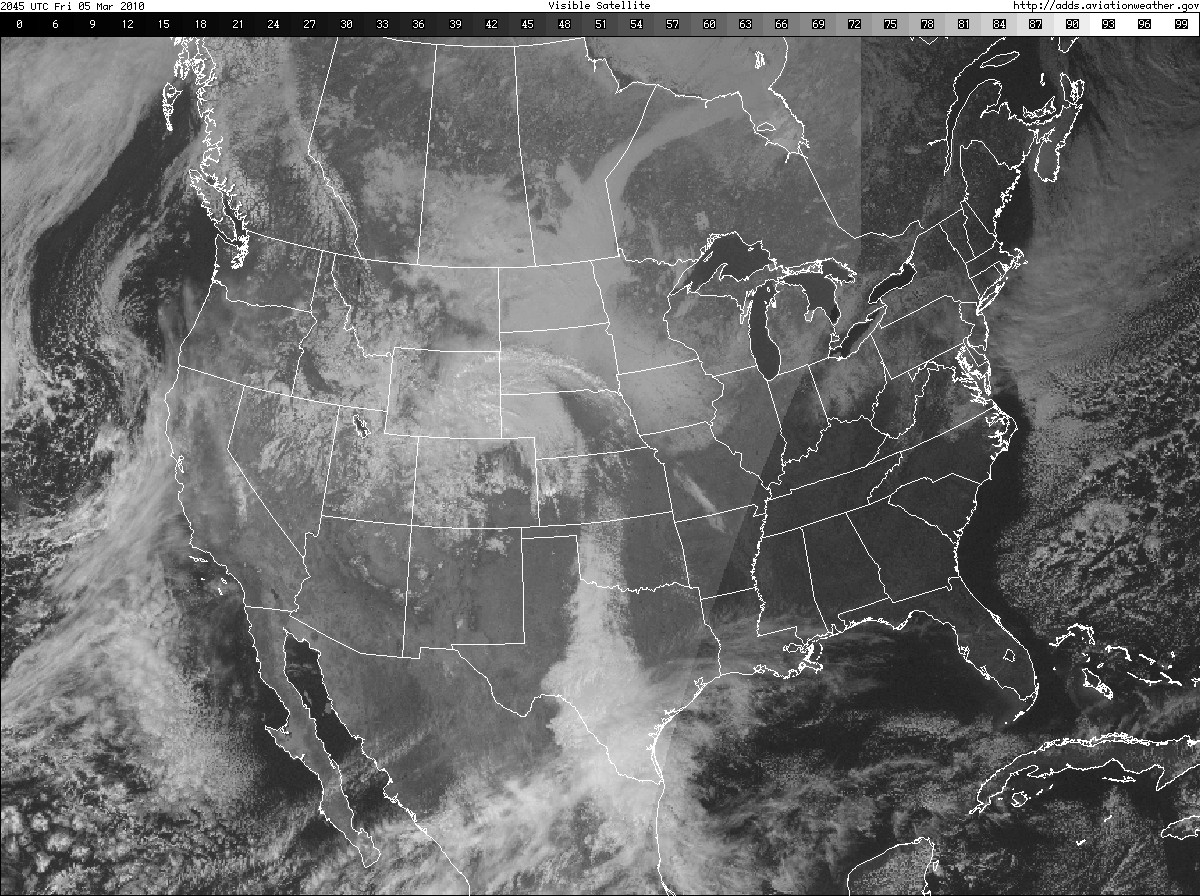
1. Cyclonic activity exists where over the CONUS?
2. The numbers along the top of the chart indicate what?
For the current chart: http://aviationweather.gov/adds/satellite/displaySat.php?region=US&isingle=single&itype=vis
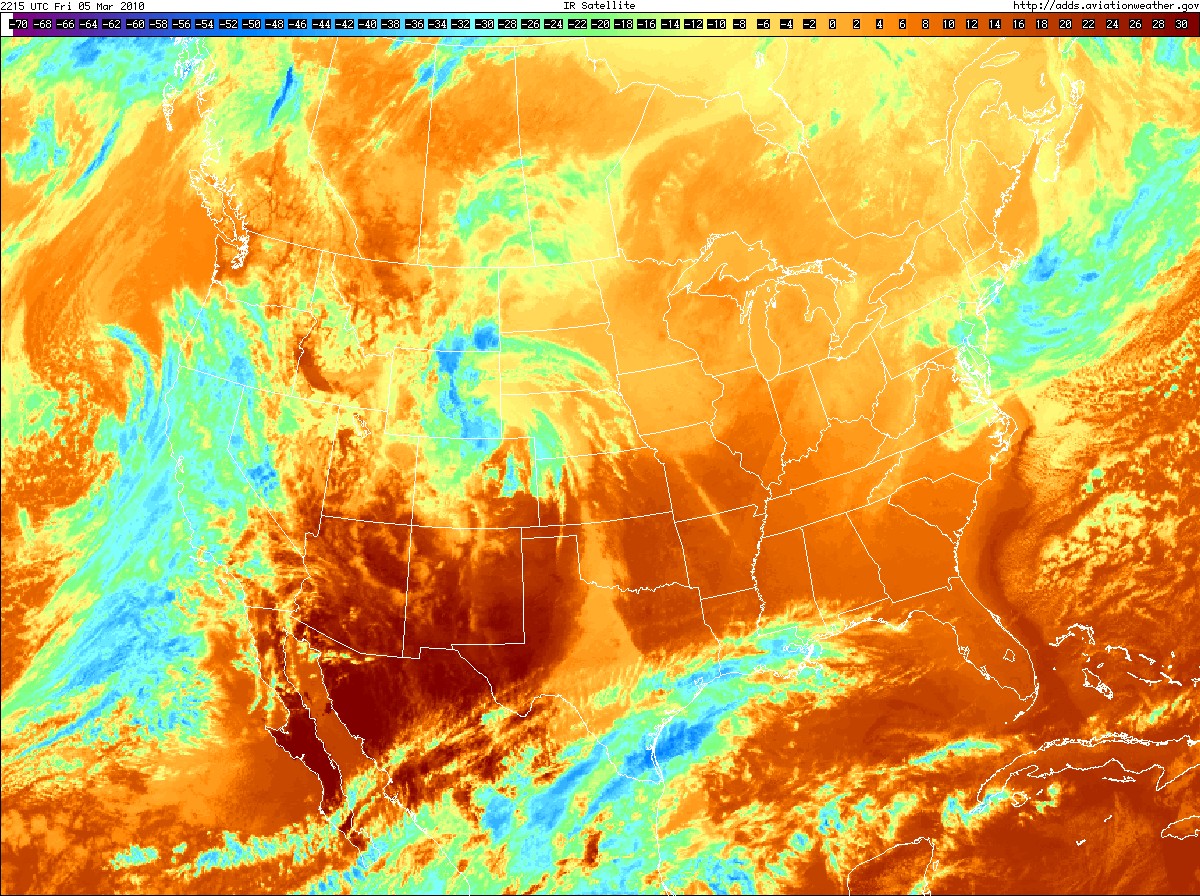
1. What type of satellite image is this?
2. What do the dark red colors indicate in Arizona?
3. What do the blue colors indicate in Wyoming?
For the current chart: http://aviationweather.gov/adds/satellite/displaySat.php?region=US&isingle=single&itype=ir
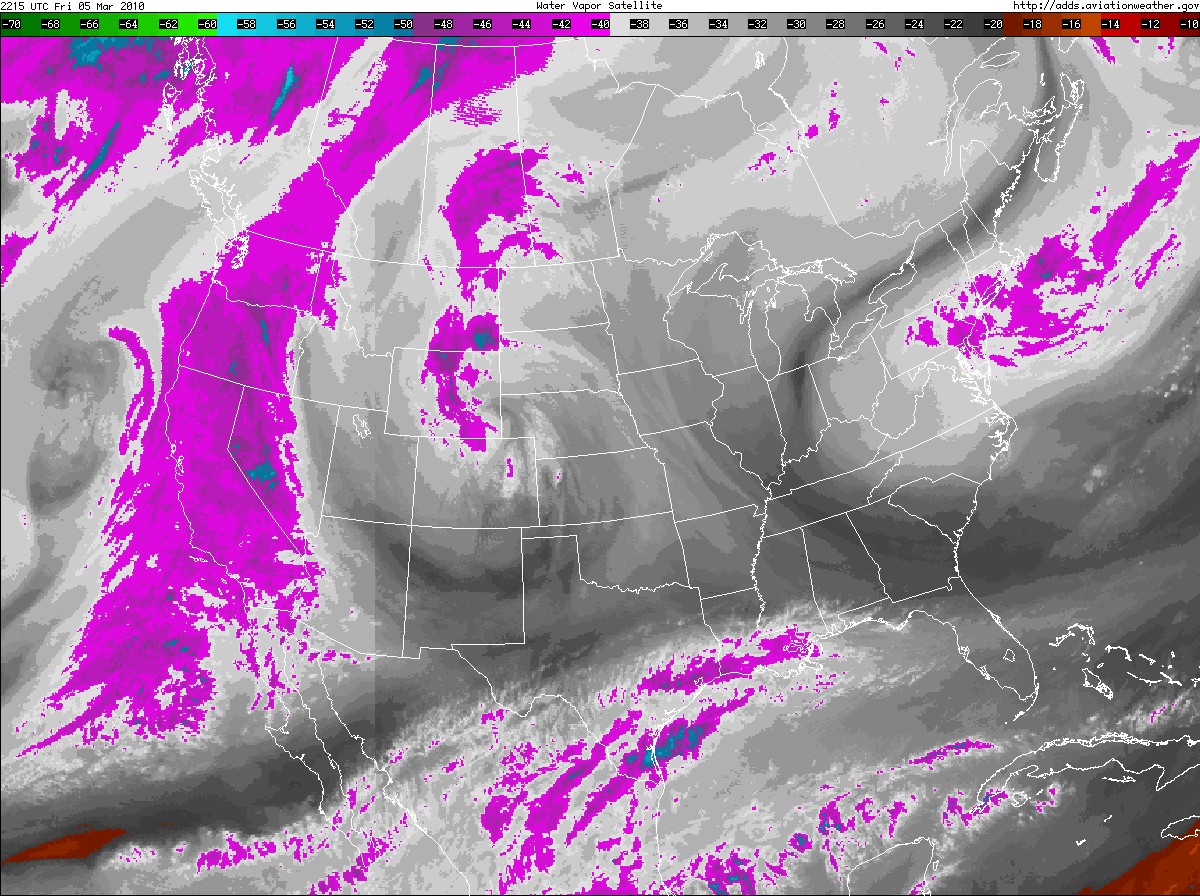
1. What does the purple color indicate on this water vapor chart?
2. What does the red color off the coast of Baja California indicate?
3. What does the scale along the top of the chart indicate?
4. Using all three of the above charts what can you say about the storm in the Wyoming area?
For the current chart: http://aviationweather.gov/adds/satellite/displaySat.php?region=US&isingle=single&itype=wv
For the next set of questions about the Surface Analysis Chart, review the chart sequence below:
1. View the entire sequence. What happens to the stationary front off the coast of WA, OR, CA?
2. Reference the 0000z chart. List the number of: warm fronts____, cold fronts____, stationary fronts____, occluded fronts____.
3. When does the dry line first appear?
4. Using your knowledge of what a dry line is and the above satellite images, what can you say about the likely wx in southwest Tx?
5. Using the above satellite images and the 2100z SA below what can you say about the Low centered in Wyoming?
6. Observe the 1800z chart. Answer the following about the Abilene Tx (central Tx) station model:
What is the temp?______, What is the dew point?______, How strong is the wind?________, What is the barometric pressure?________,
What is the pressure tendency?___________, What is the sky cover?__________.
8. Using your knowledge of source regions, what can you say about the High located in Canada just above the Montana border?
For the current chart: http://www.wpc.ncep.noaa.gov/html/sfc2.shtml
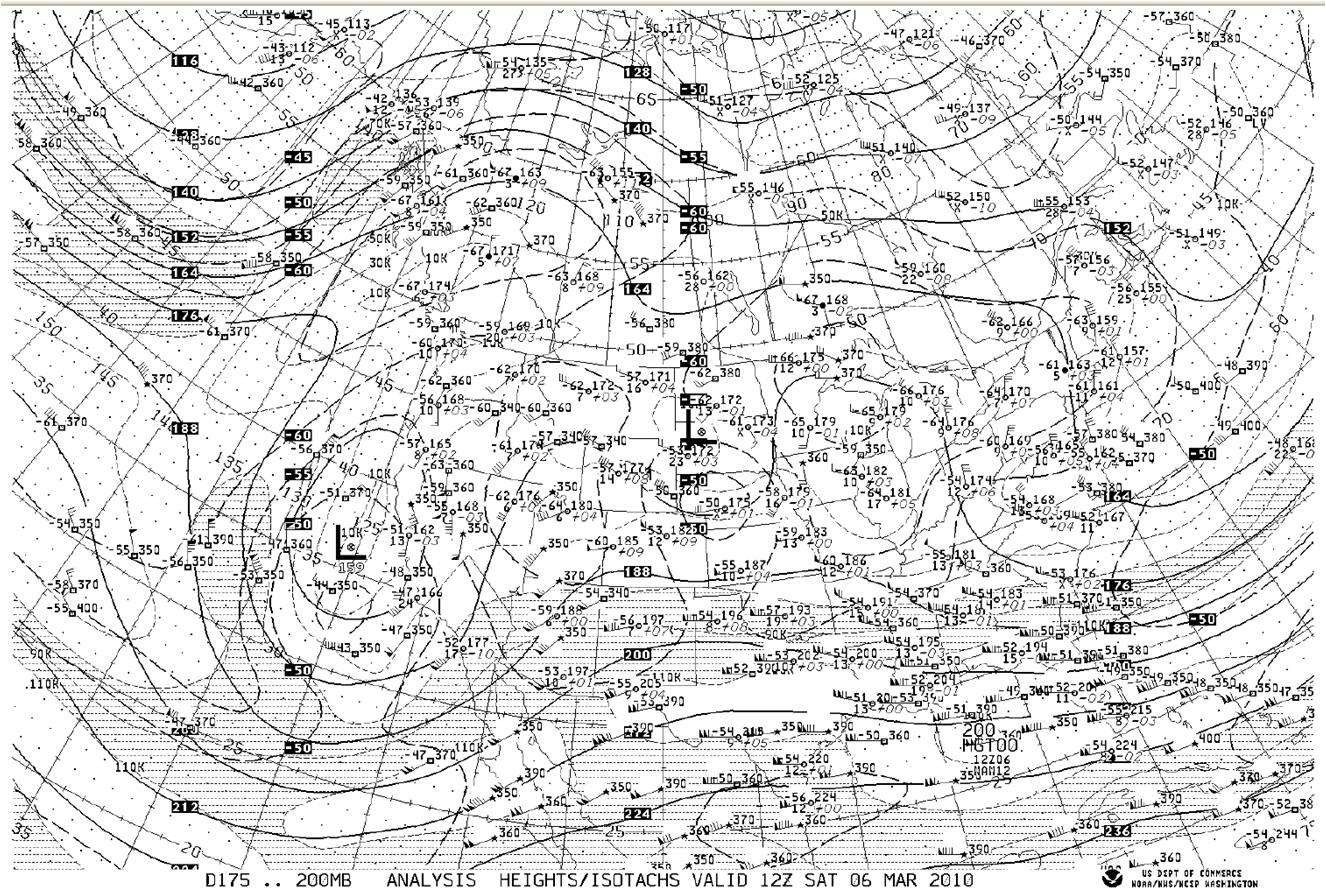
1. Using the GEG (Spokane) model: The height of 200MB is ______, The temp is ____, The wind speed and direction is _______, The height change is ____,
2. The hatched area over Arizona and New Mexico indicates what wind speeds?
3. The clear area over central Texas indicates what wind speeds?
For a current chart: ftp://tgftp.nws.noaa.gov/fax/barotrop.shtml.
1. What does the hatched area indicate in North Dakota?
2. What is the freezing level over Moses Lake?
3. What does the white area along the California Nevada border indicate?
For a current chart: http://aviationweather.gov/adds/icing/frzg_nav.php
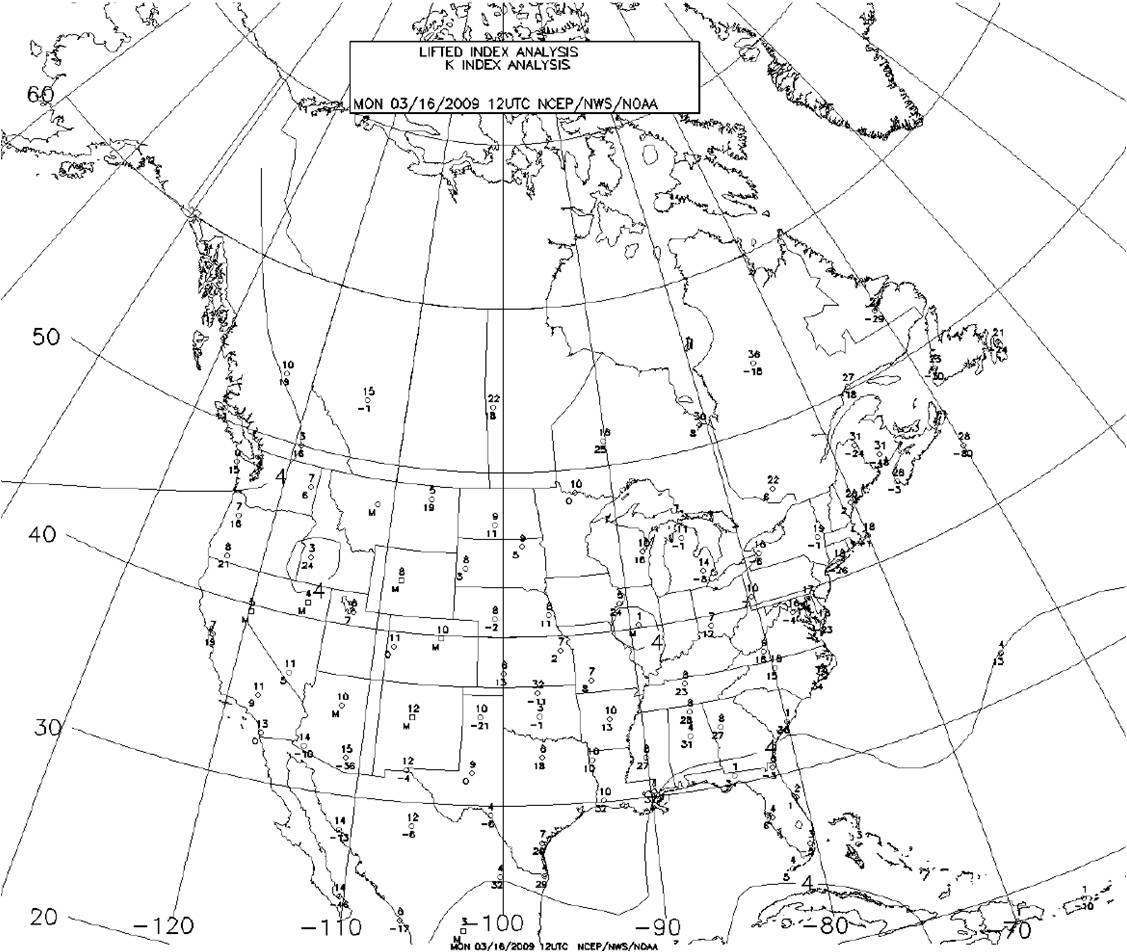
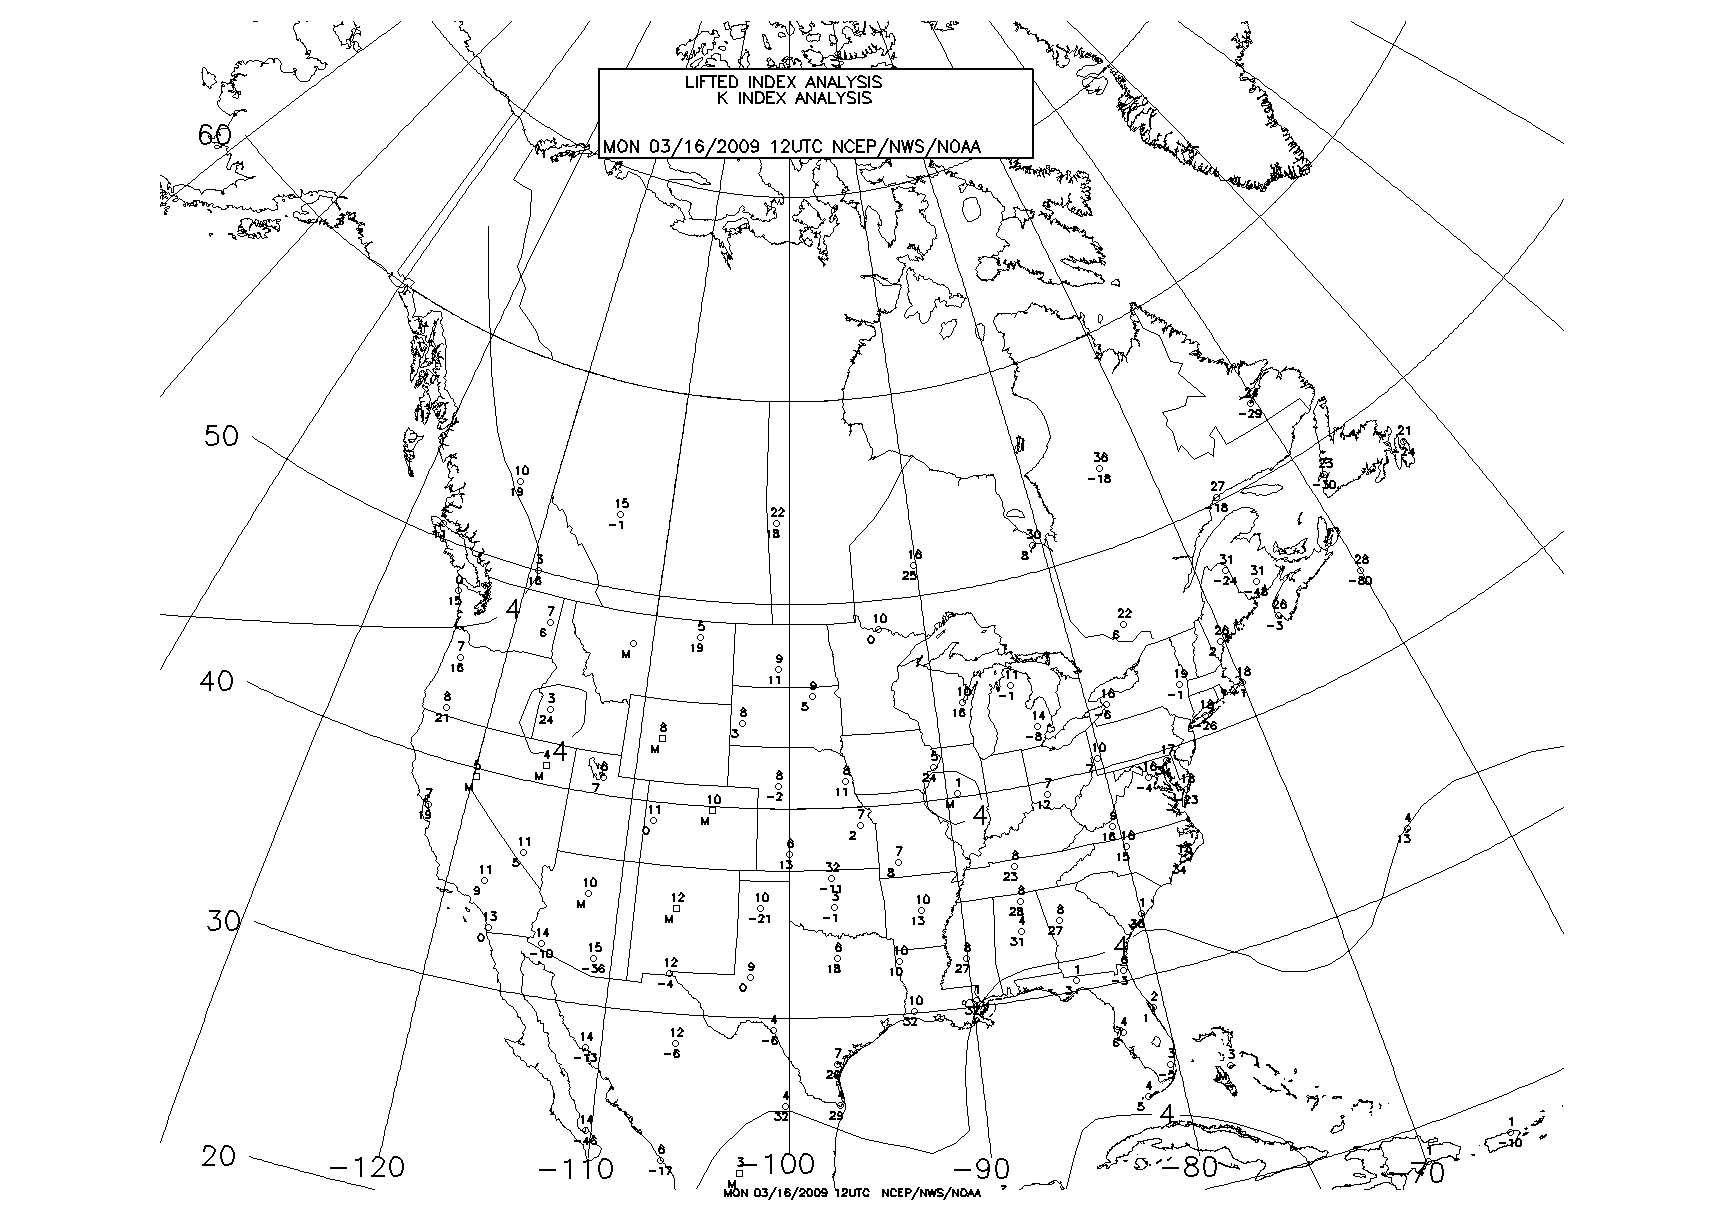
1. According to the Lifted Index chart, the place which is the most stable is over/adjacent to what state?
2. What does the M in Montana indicate?
3. What do the numbers for the station in Tennessee indicate?
Current chart:
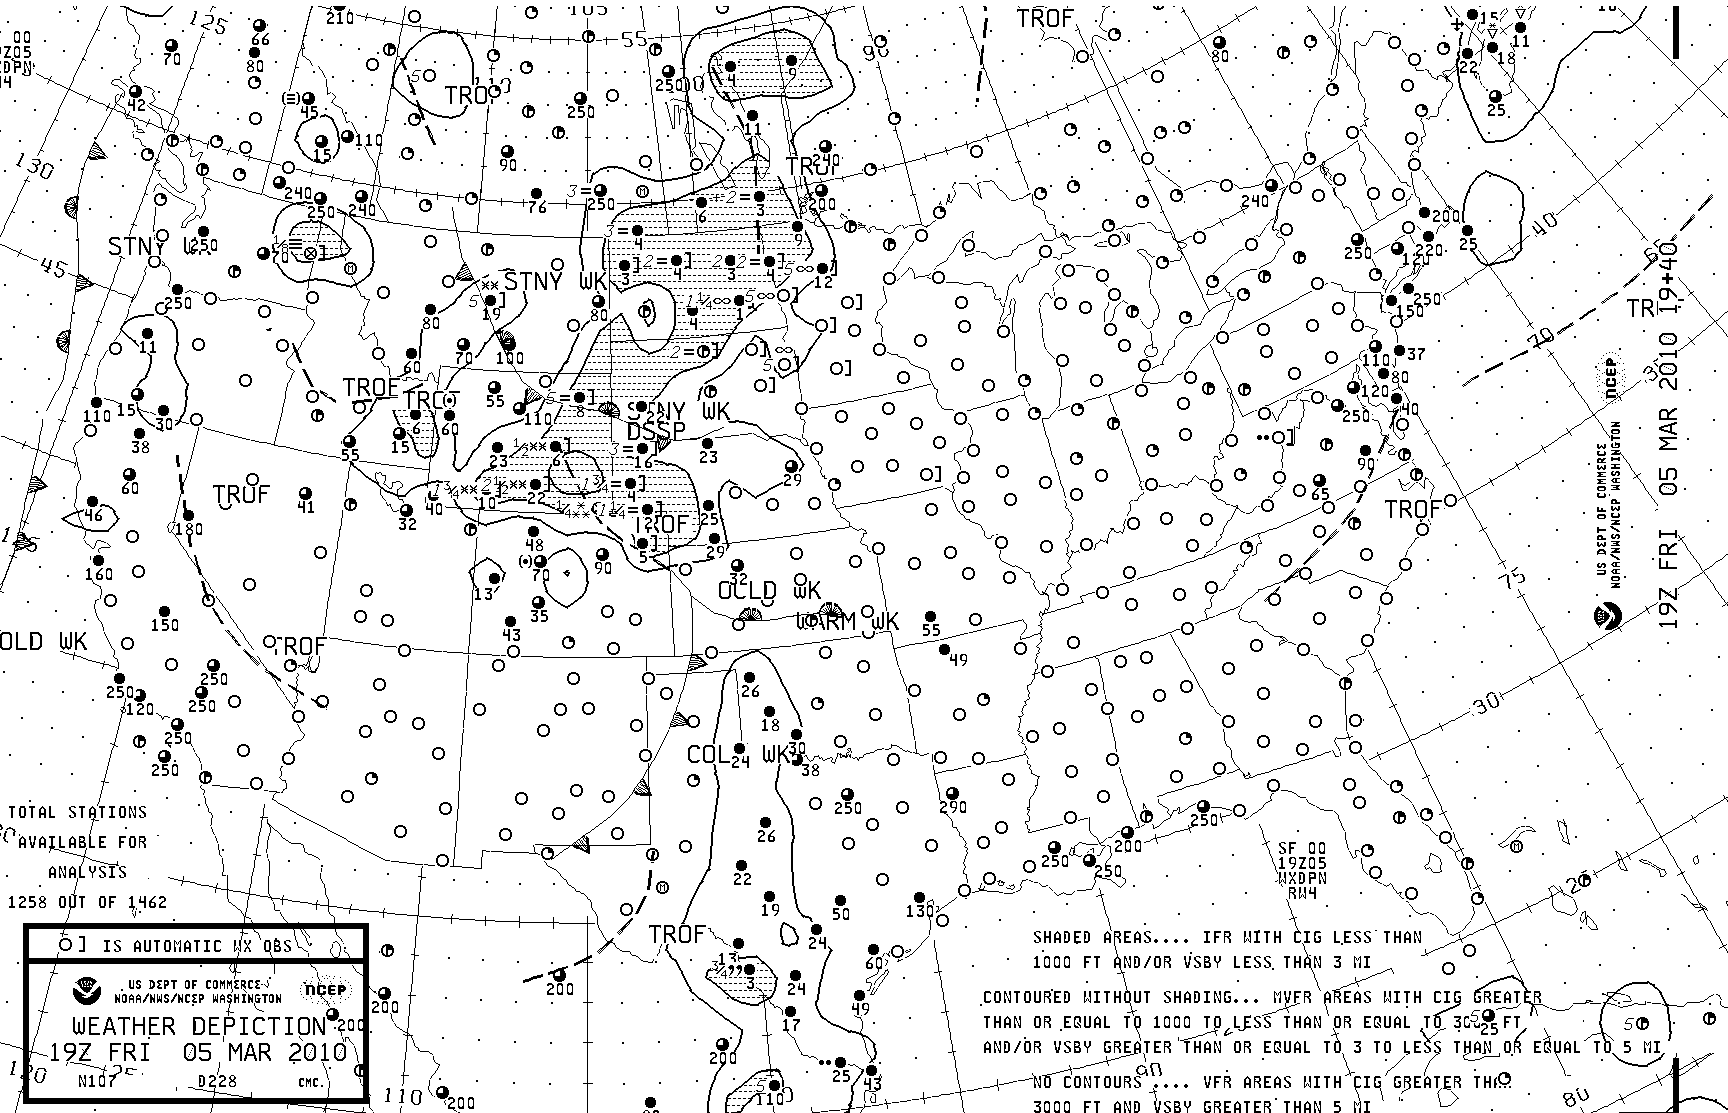
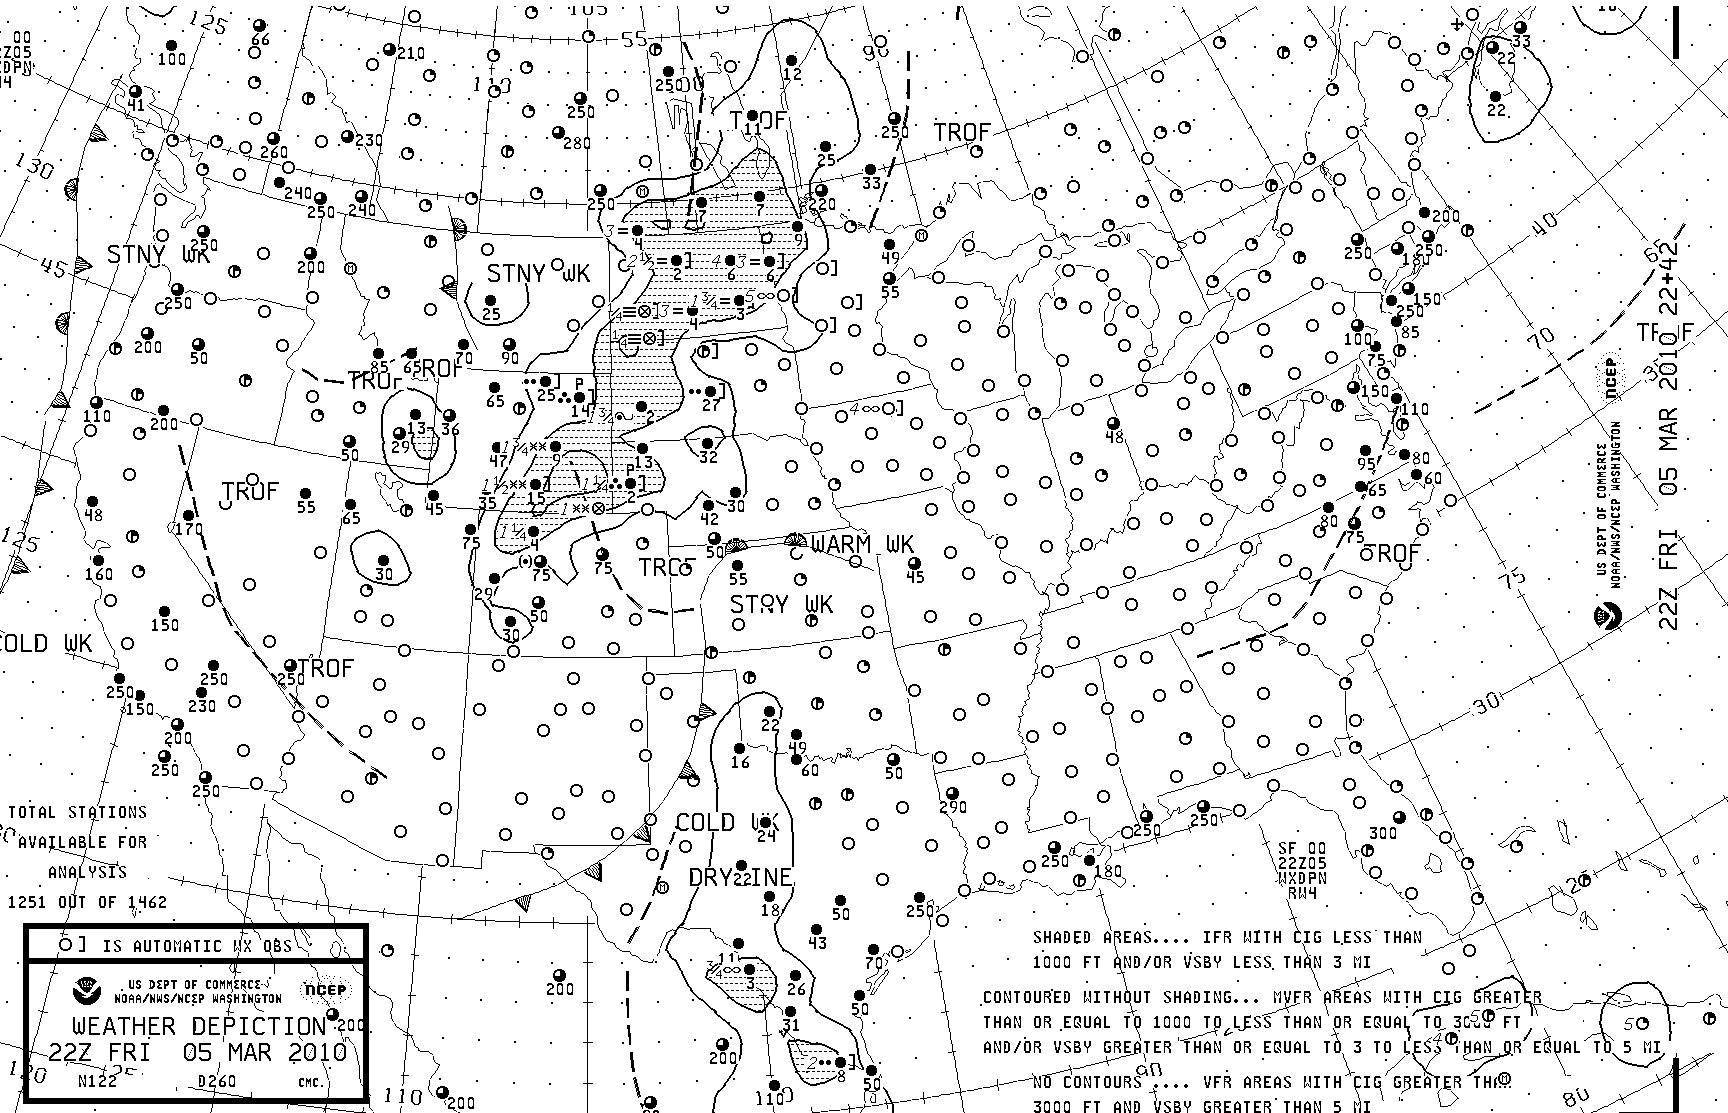
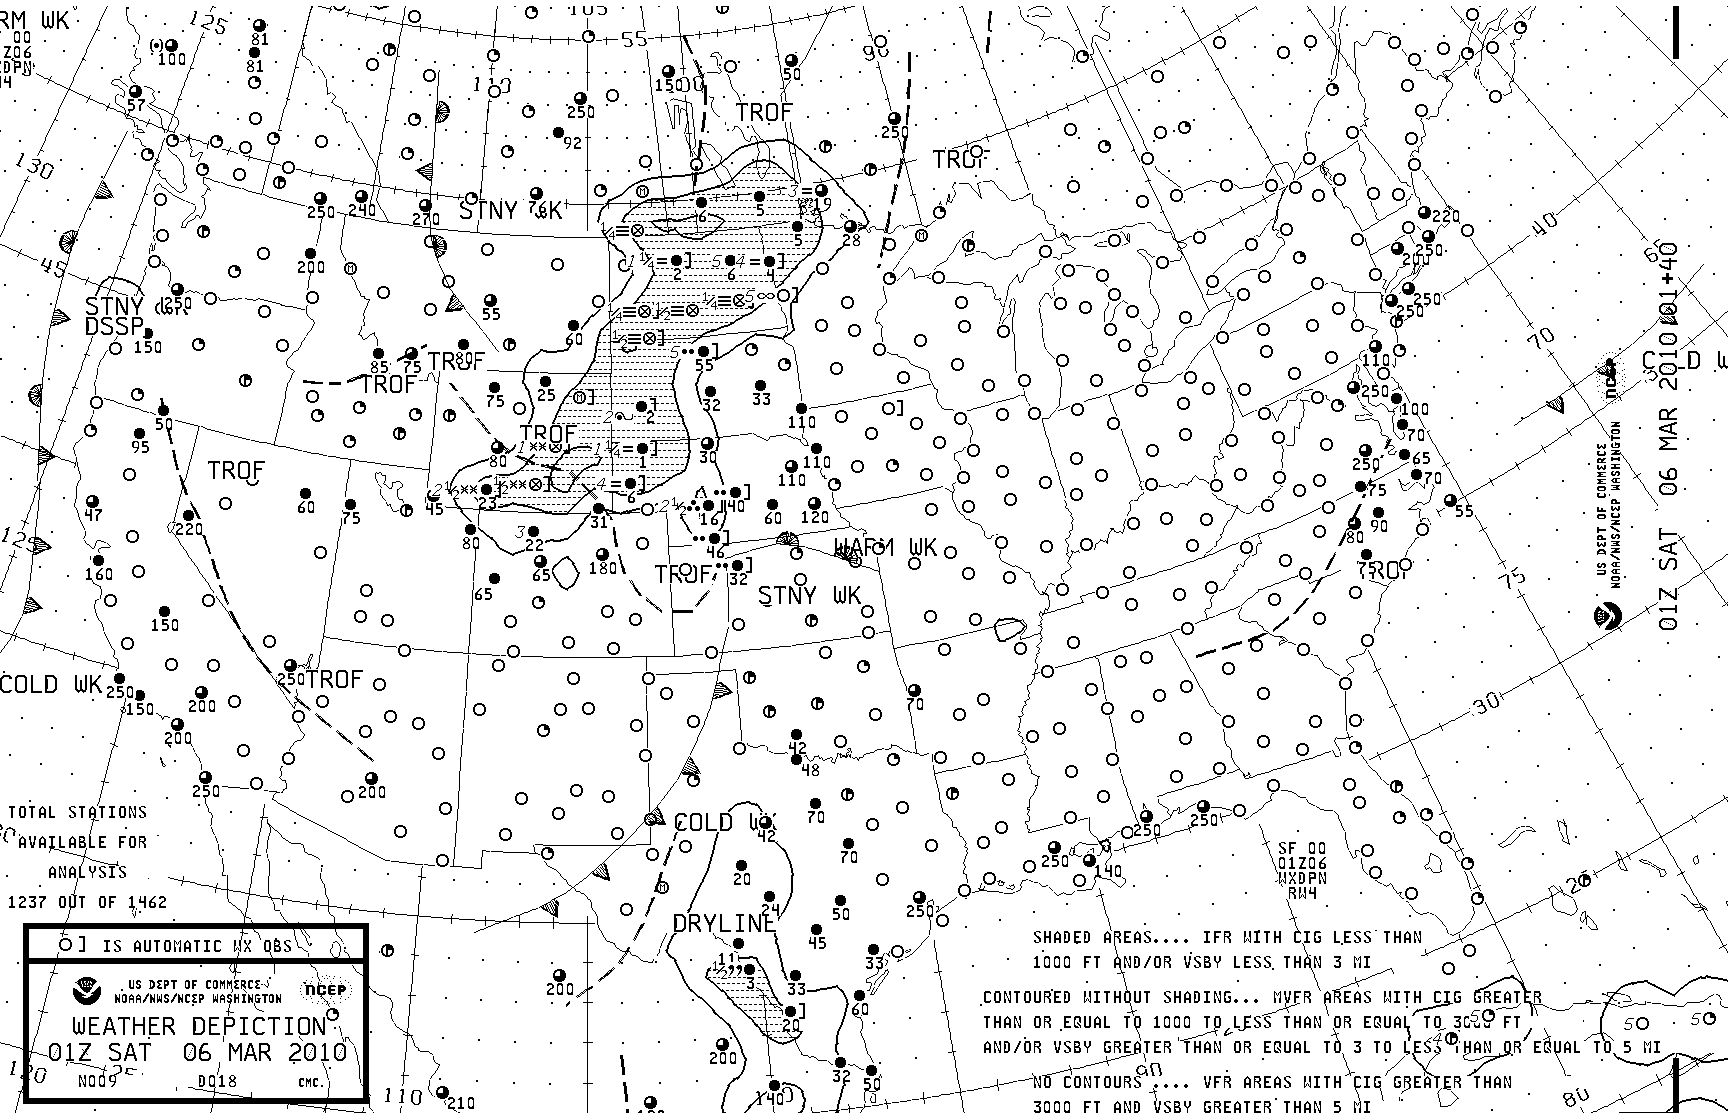
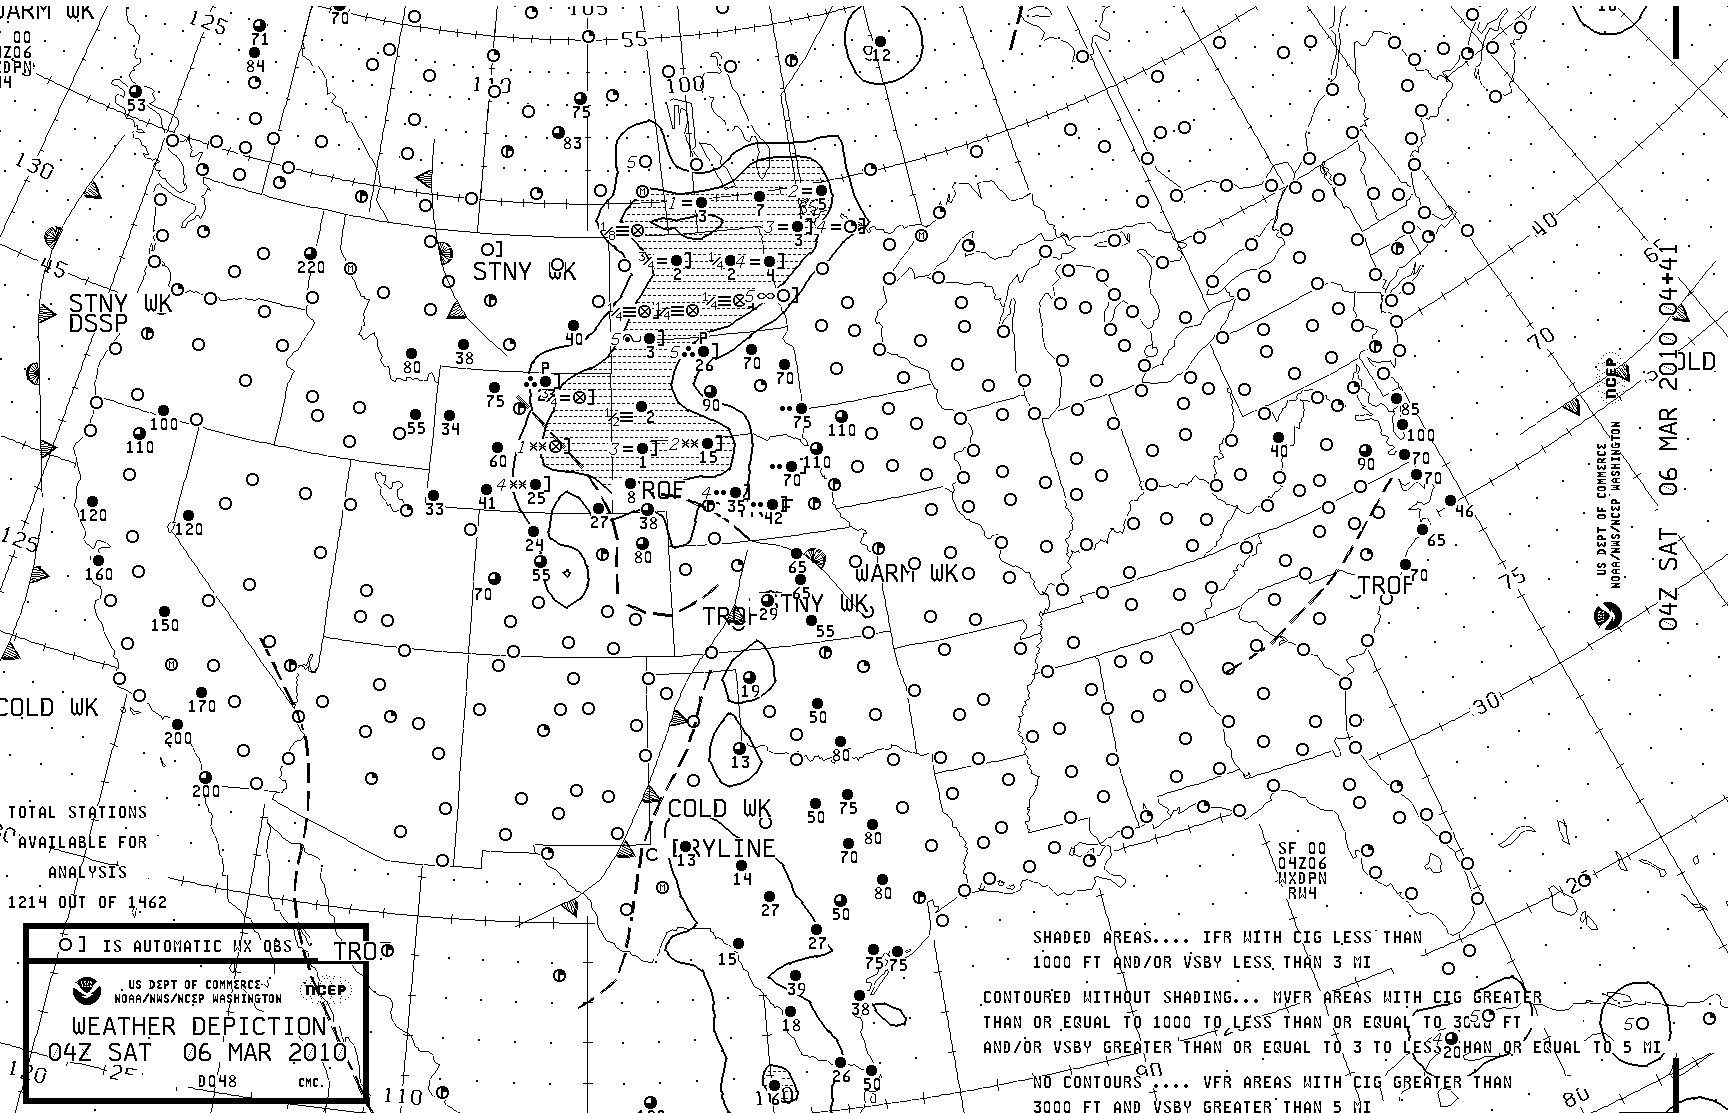
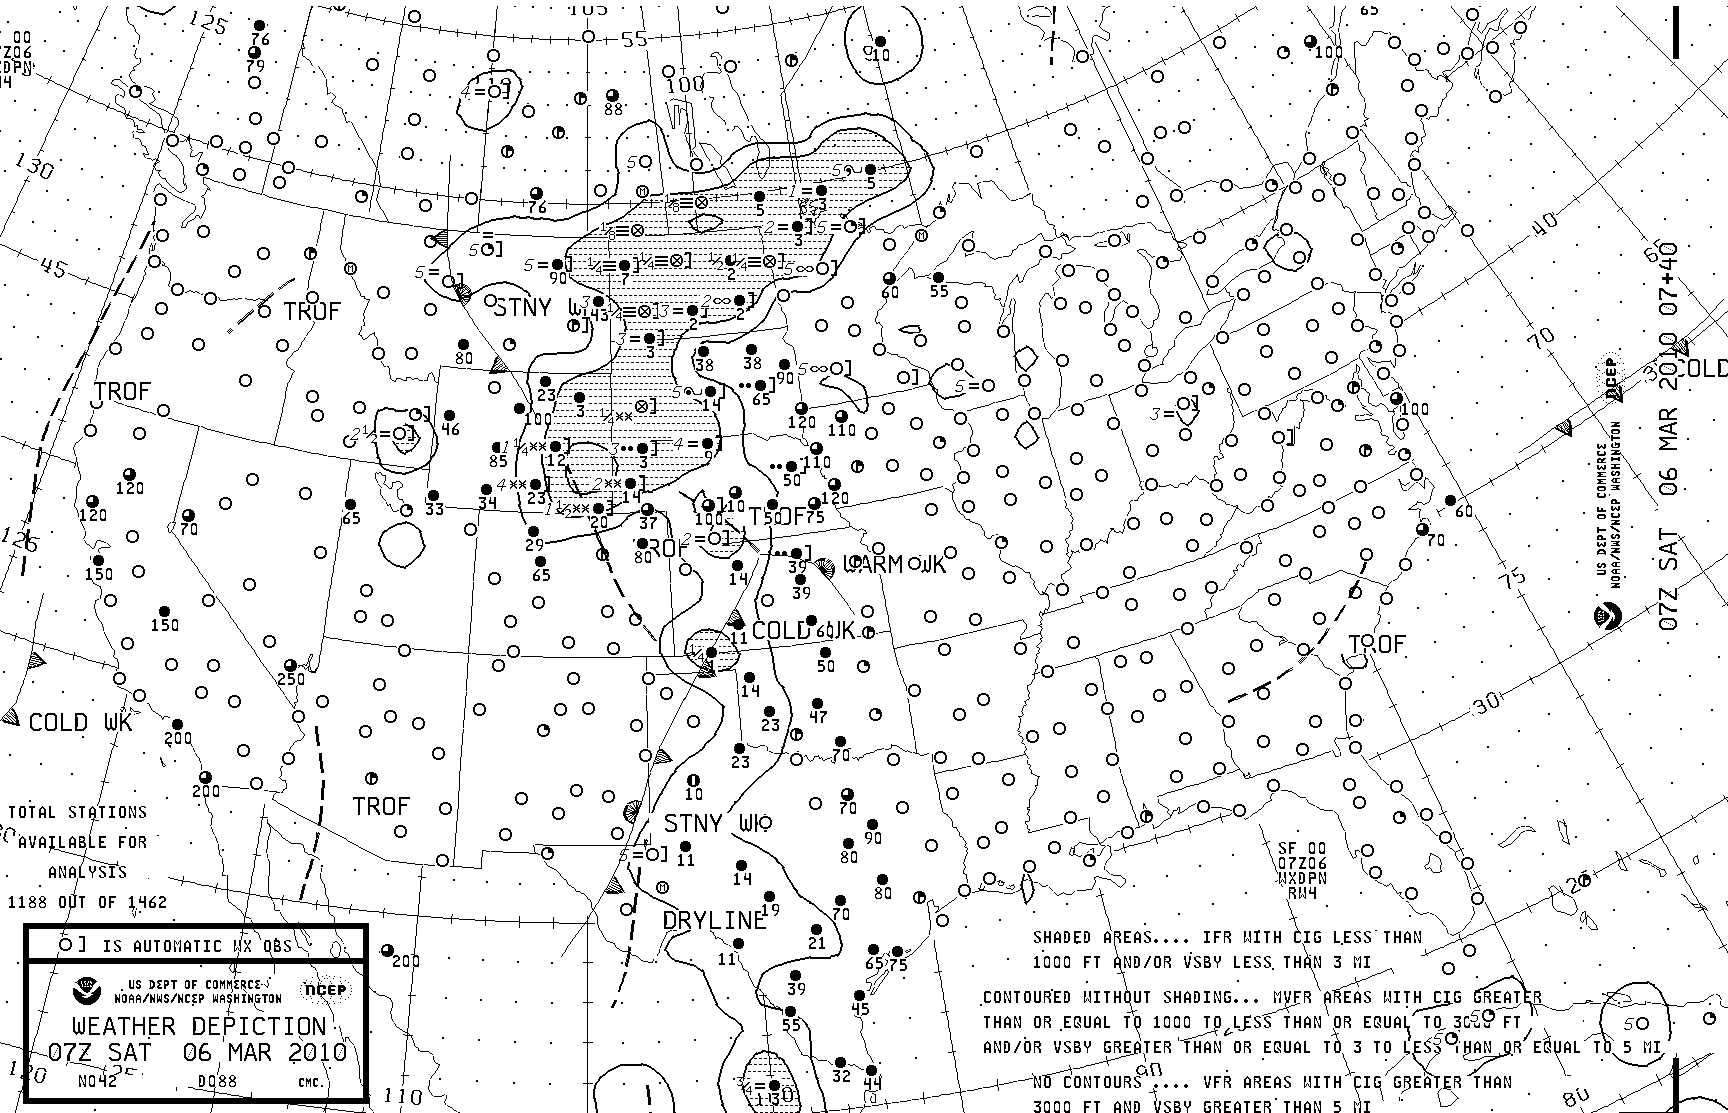
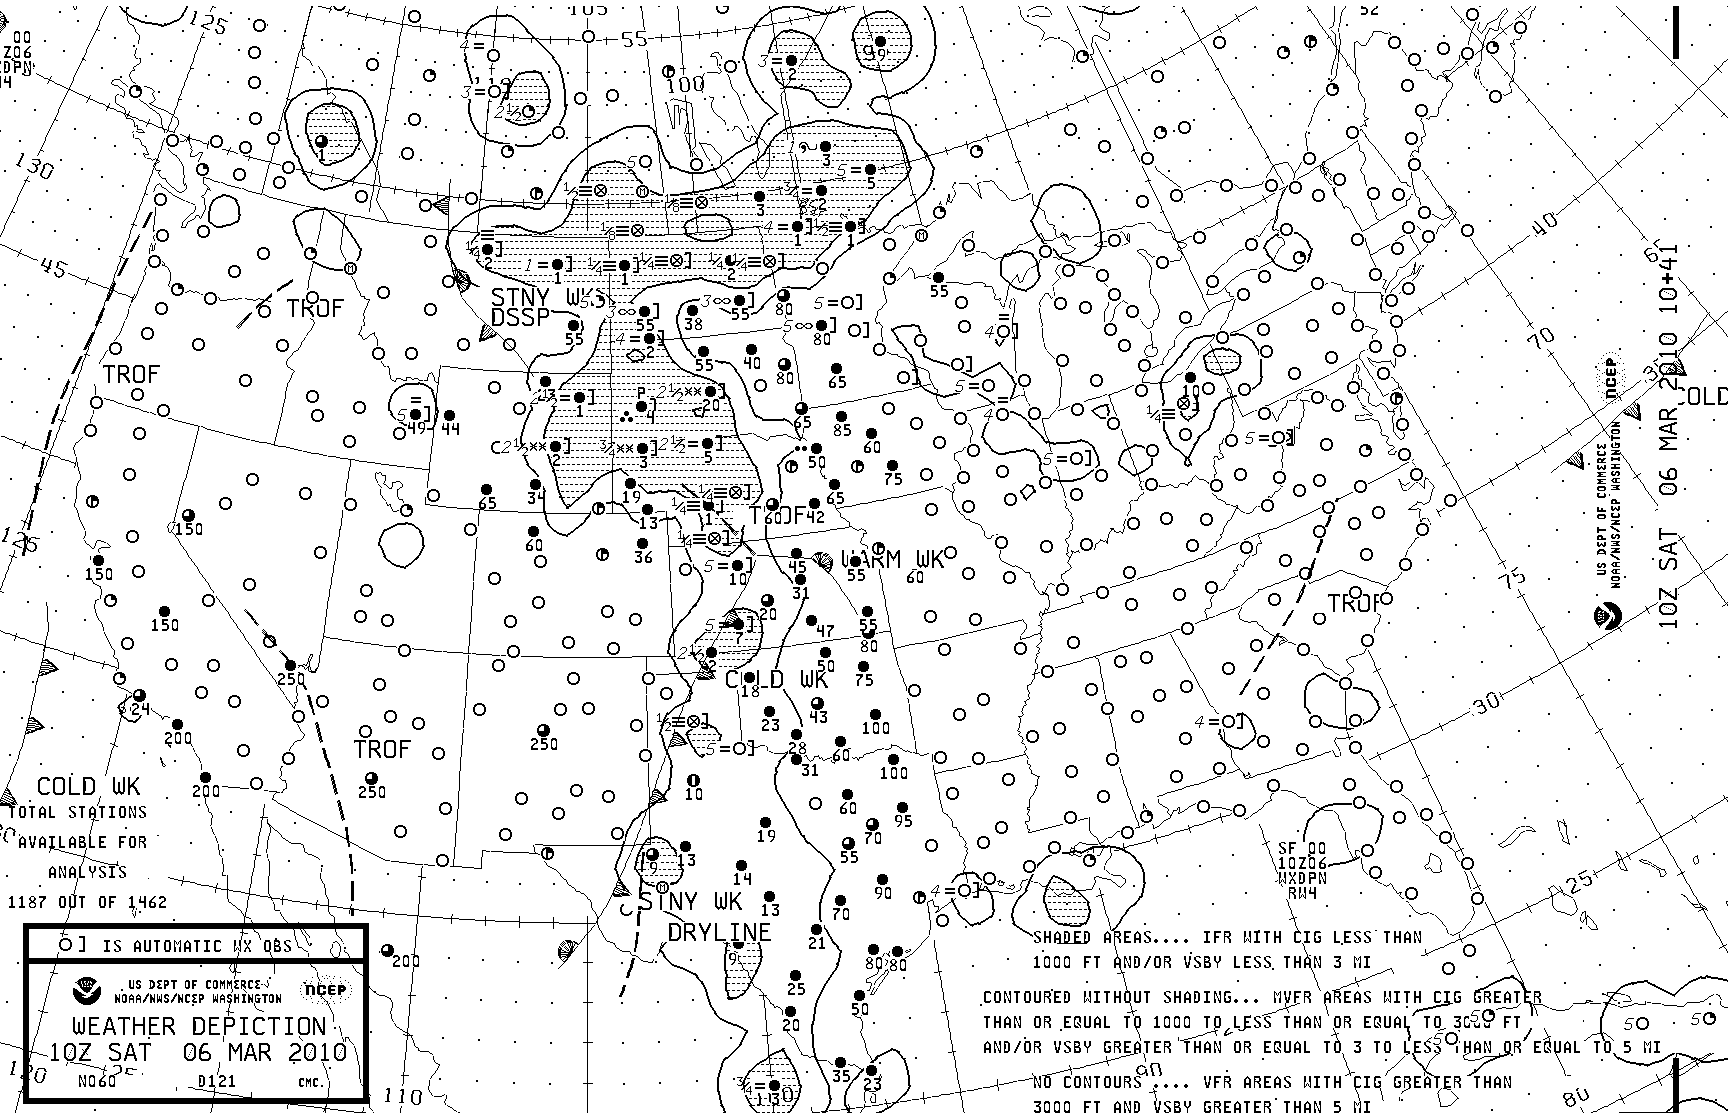
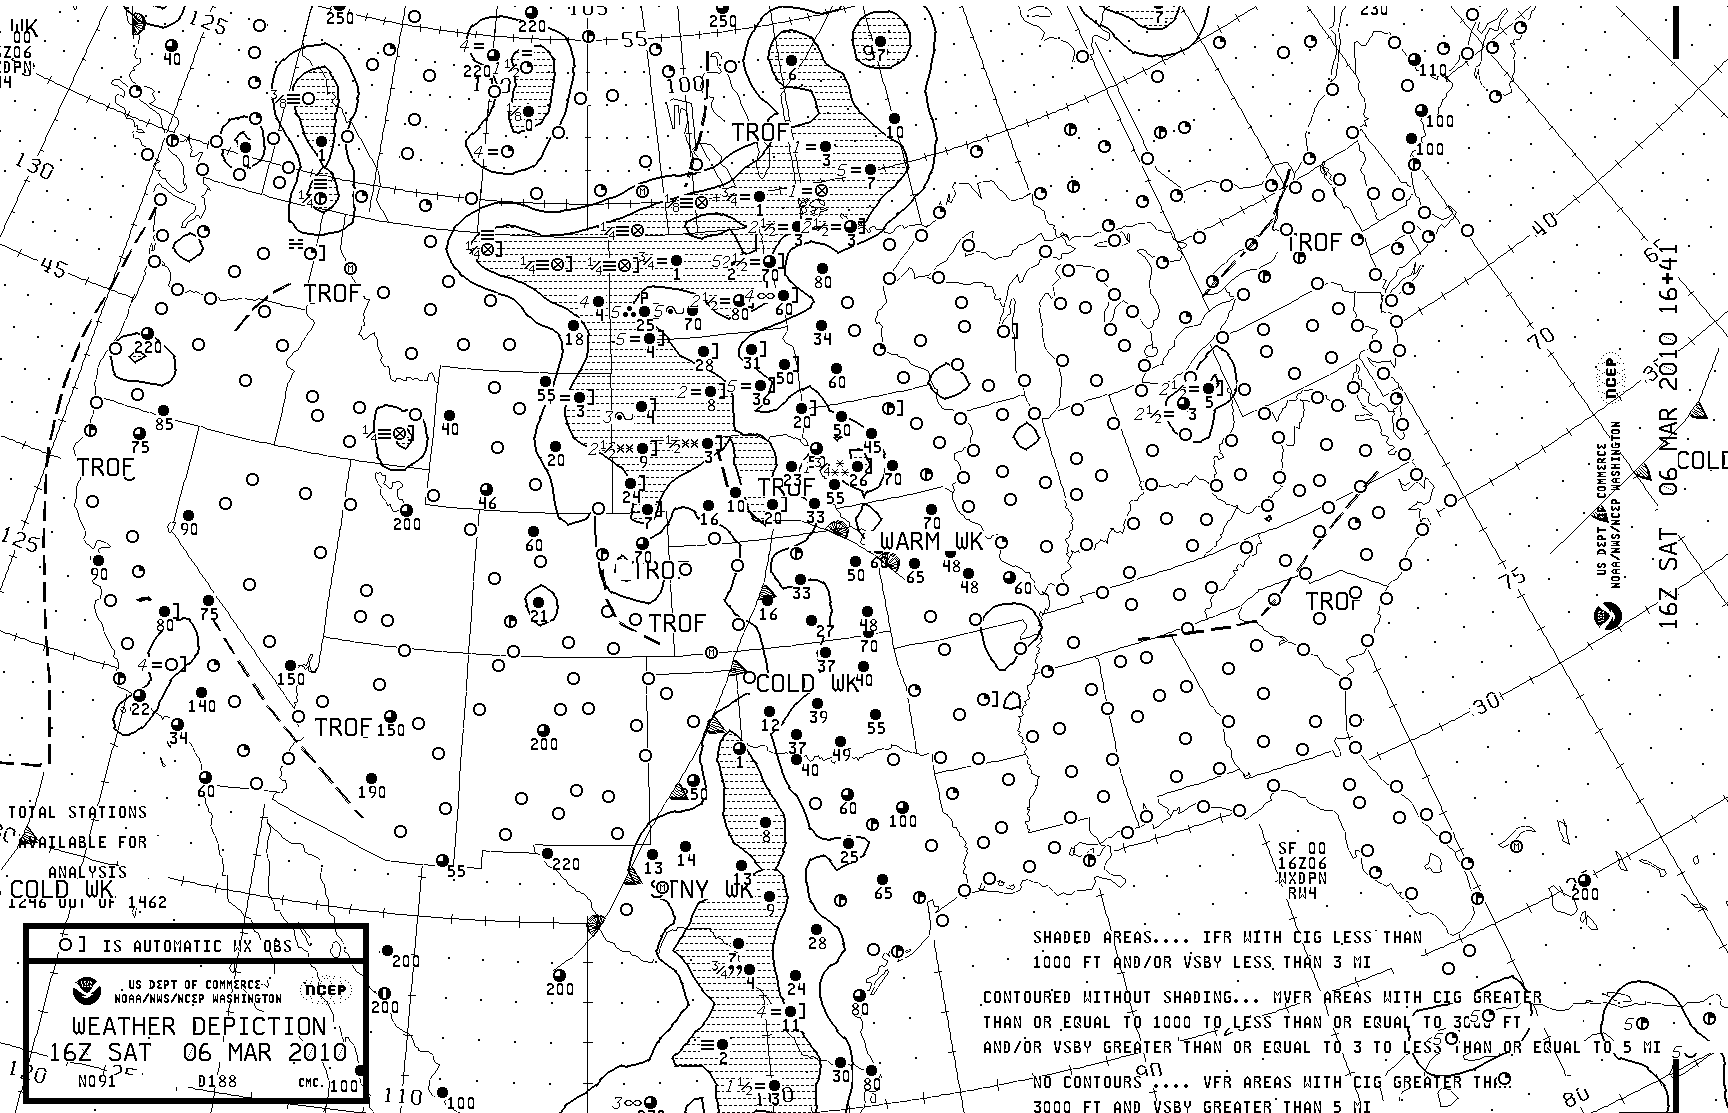
For the next set of questions about the Weather Depiction Chart, review the chart sequence below:
1. According to the Weather Depiction Charts from 1900z to 1600z North Dakota is experiencing: 1. VFR 2. MVFR or 3. IFR
2. What are the limitations to visibility in the North and South Dakota region?
3. What different types of precipitation fall in North and South Dakota over the sequence?
4. According to the 0100z chart, south central Texas is experiencing what type of precip?
5. What is the range in ceiling heights for Texas over the sequence (lowest to highest)?
6. What happens to the stationary front off the coast of WA, OR, and CA? Does that agree with the SA charts?
7. Note the snow in south central Wyoming. Does the freezing level chart above support the report of snow in Wyoming?
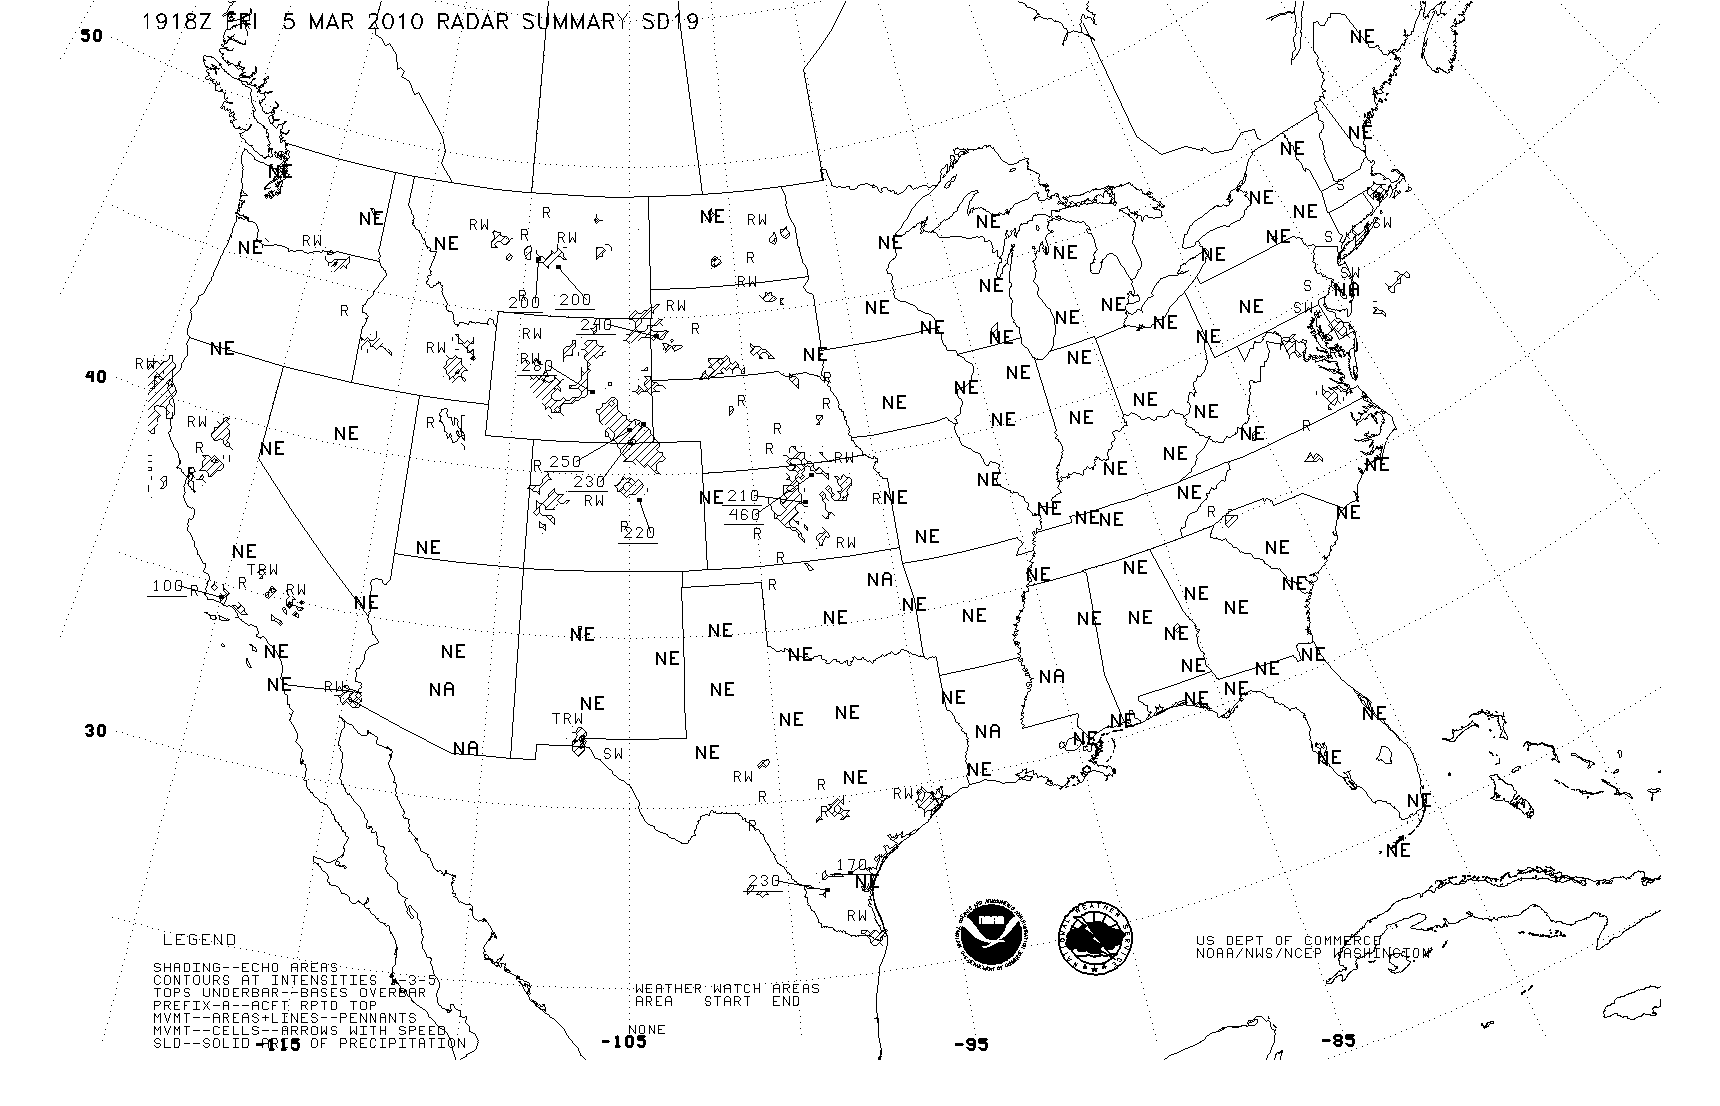
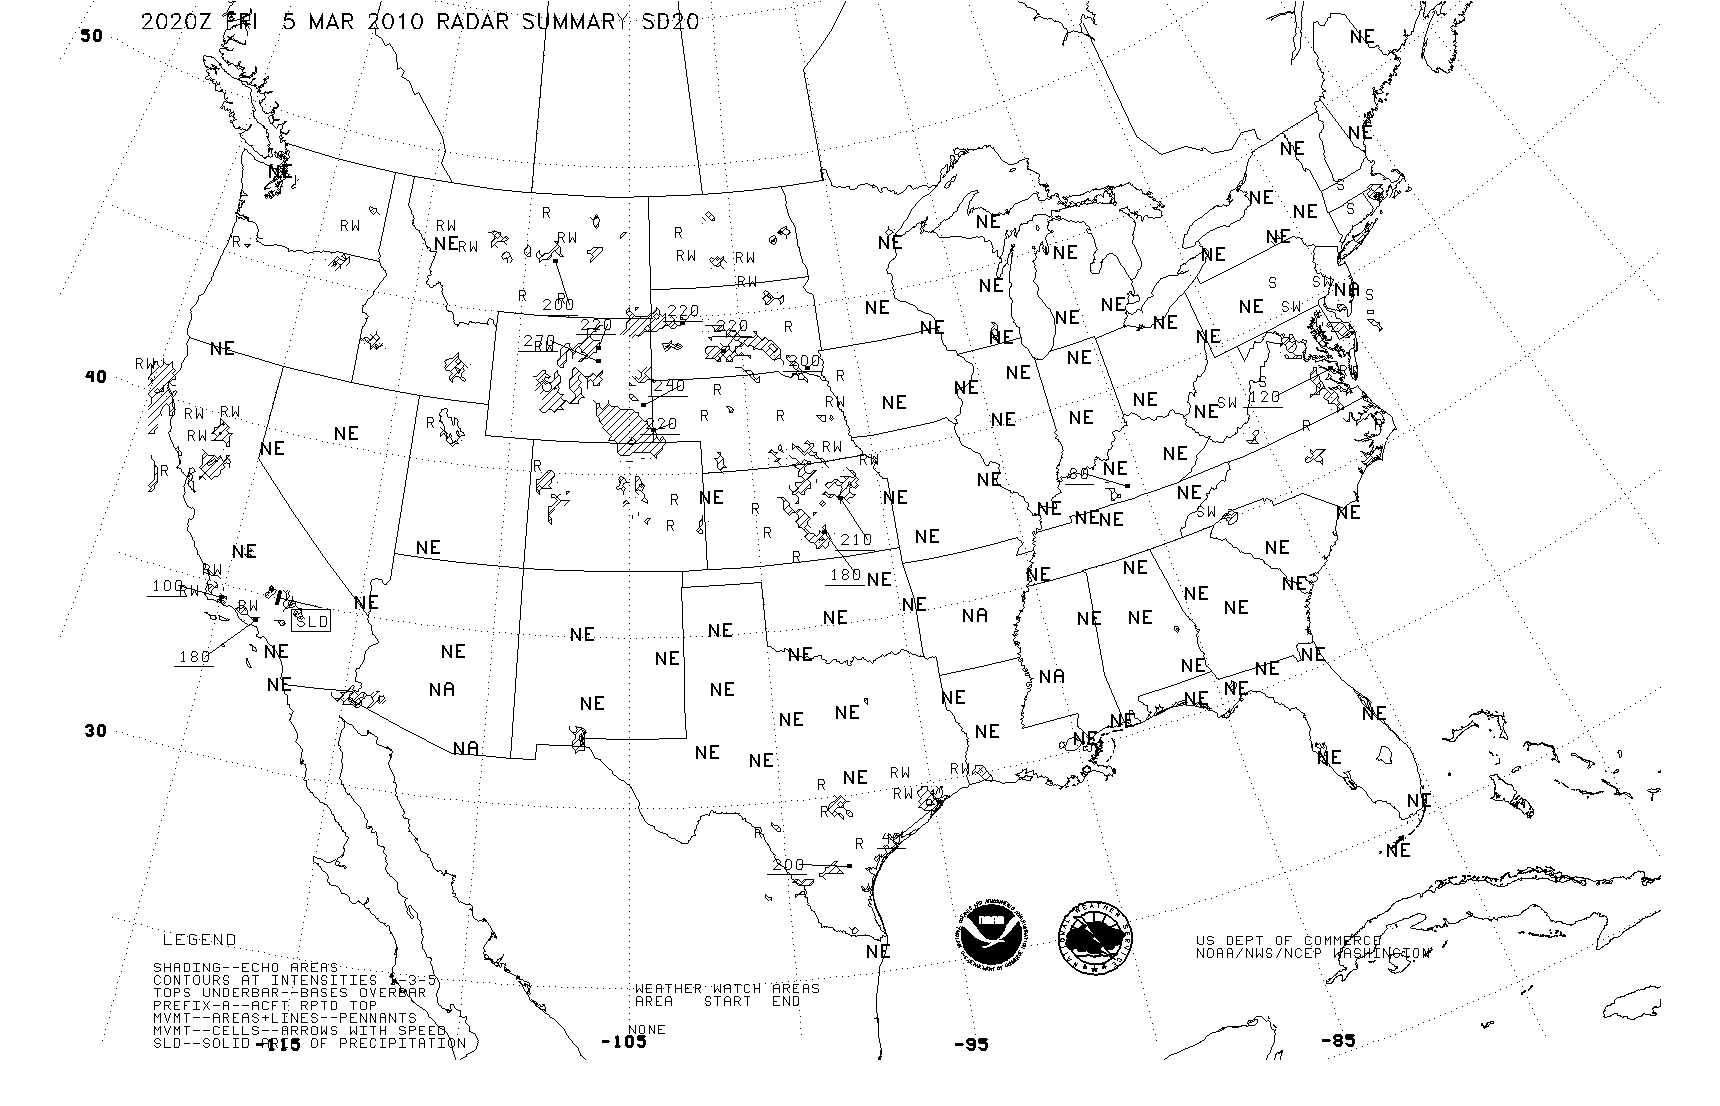
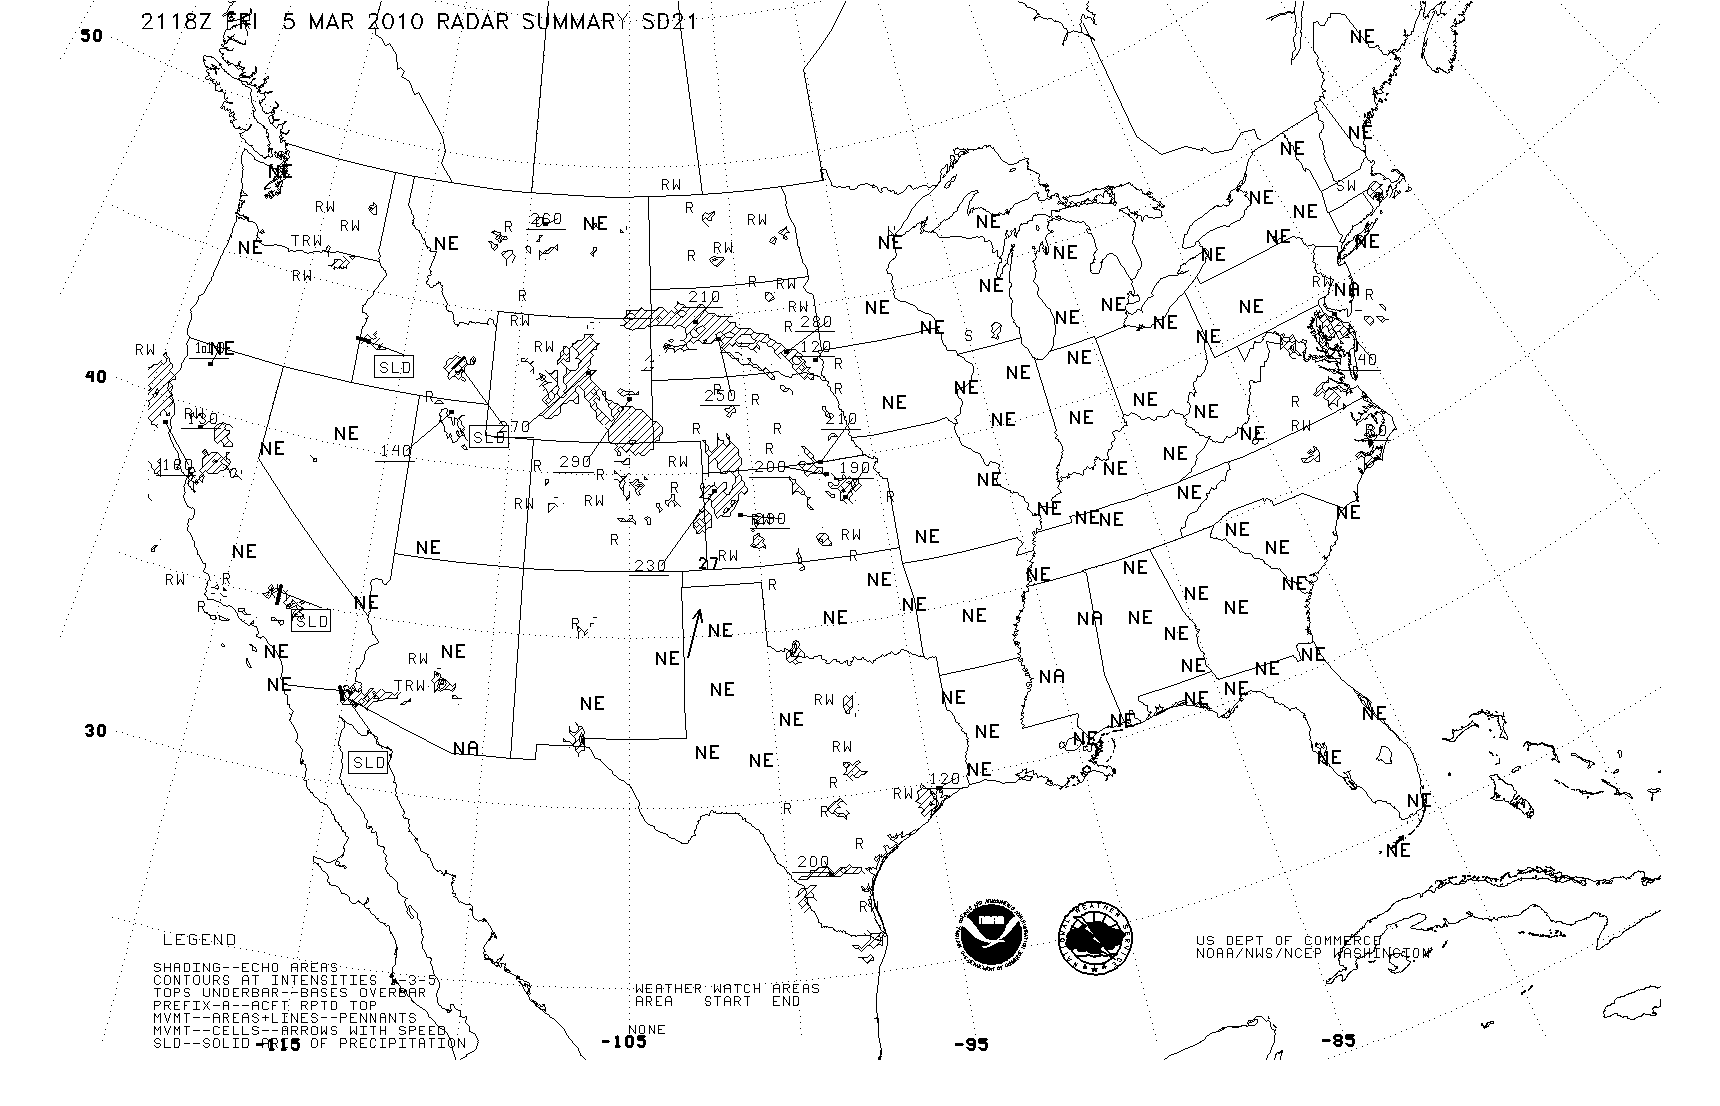
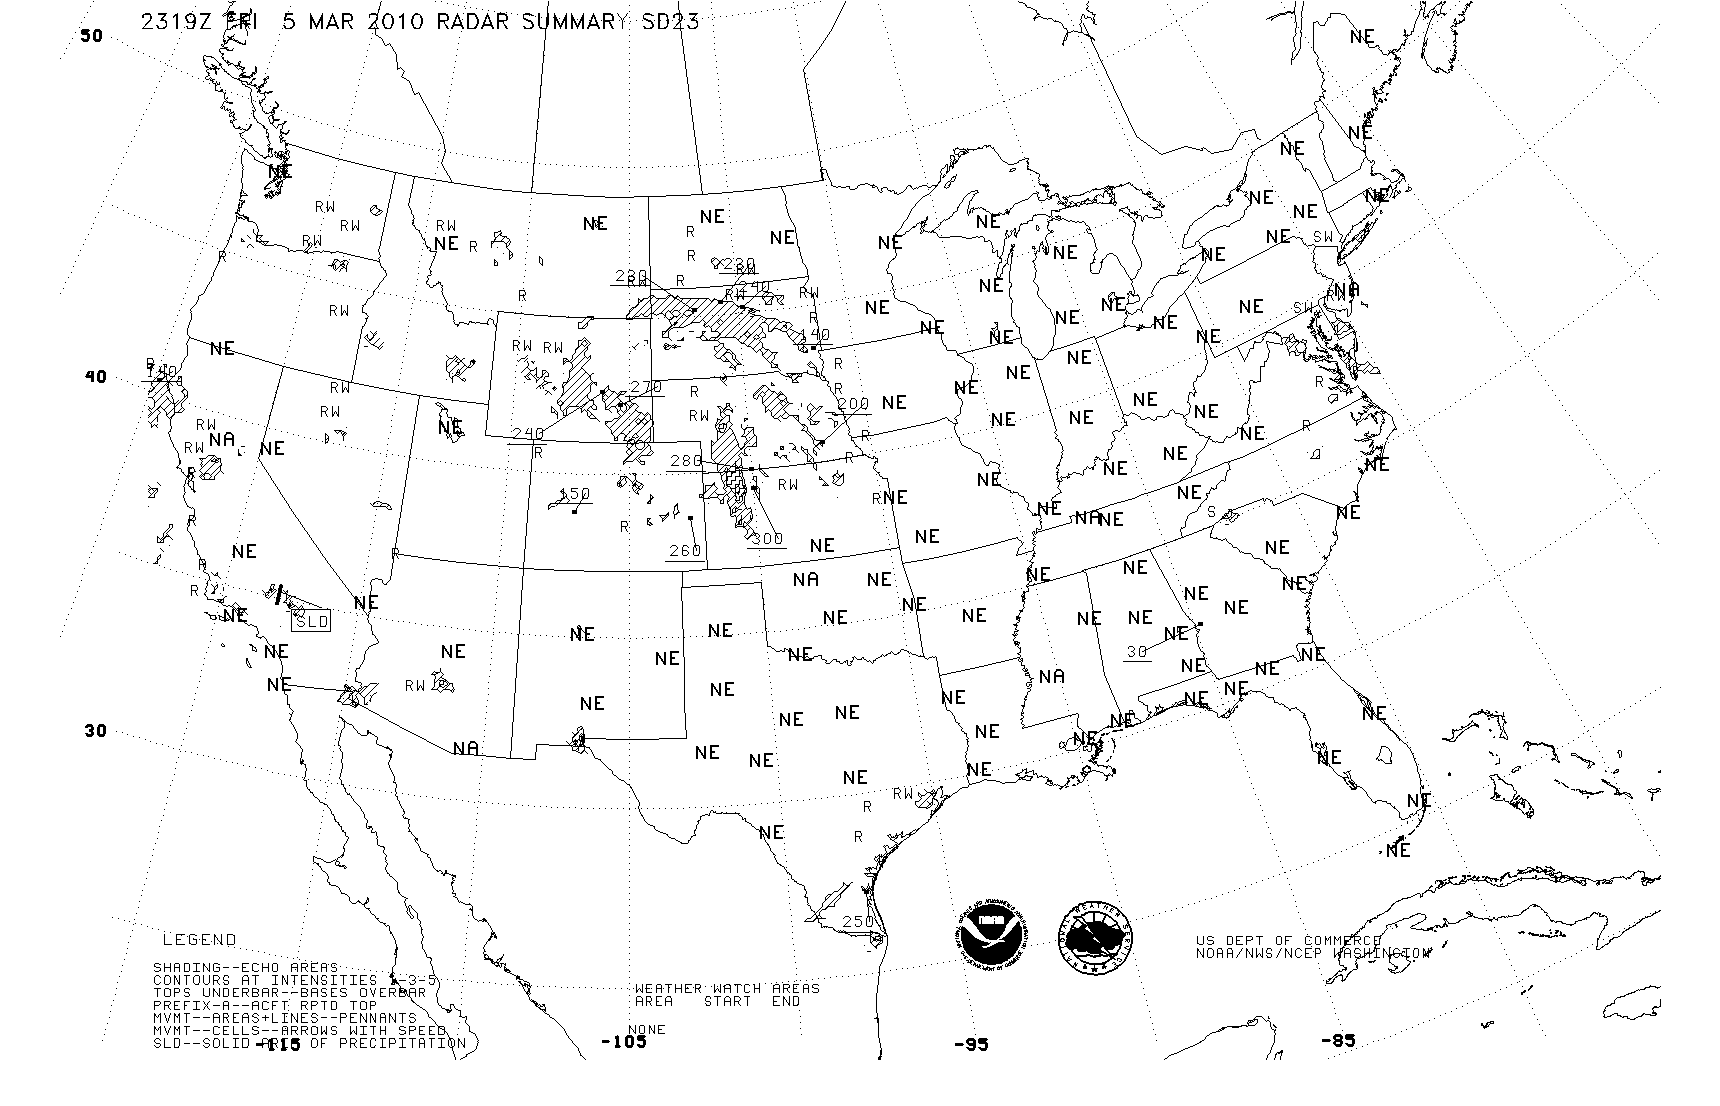
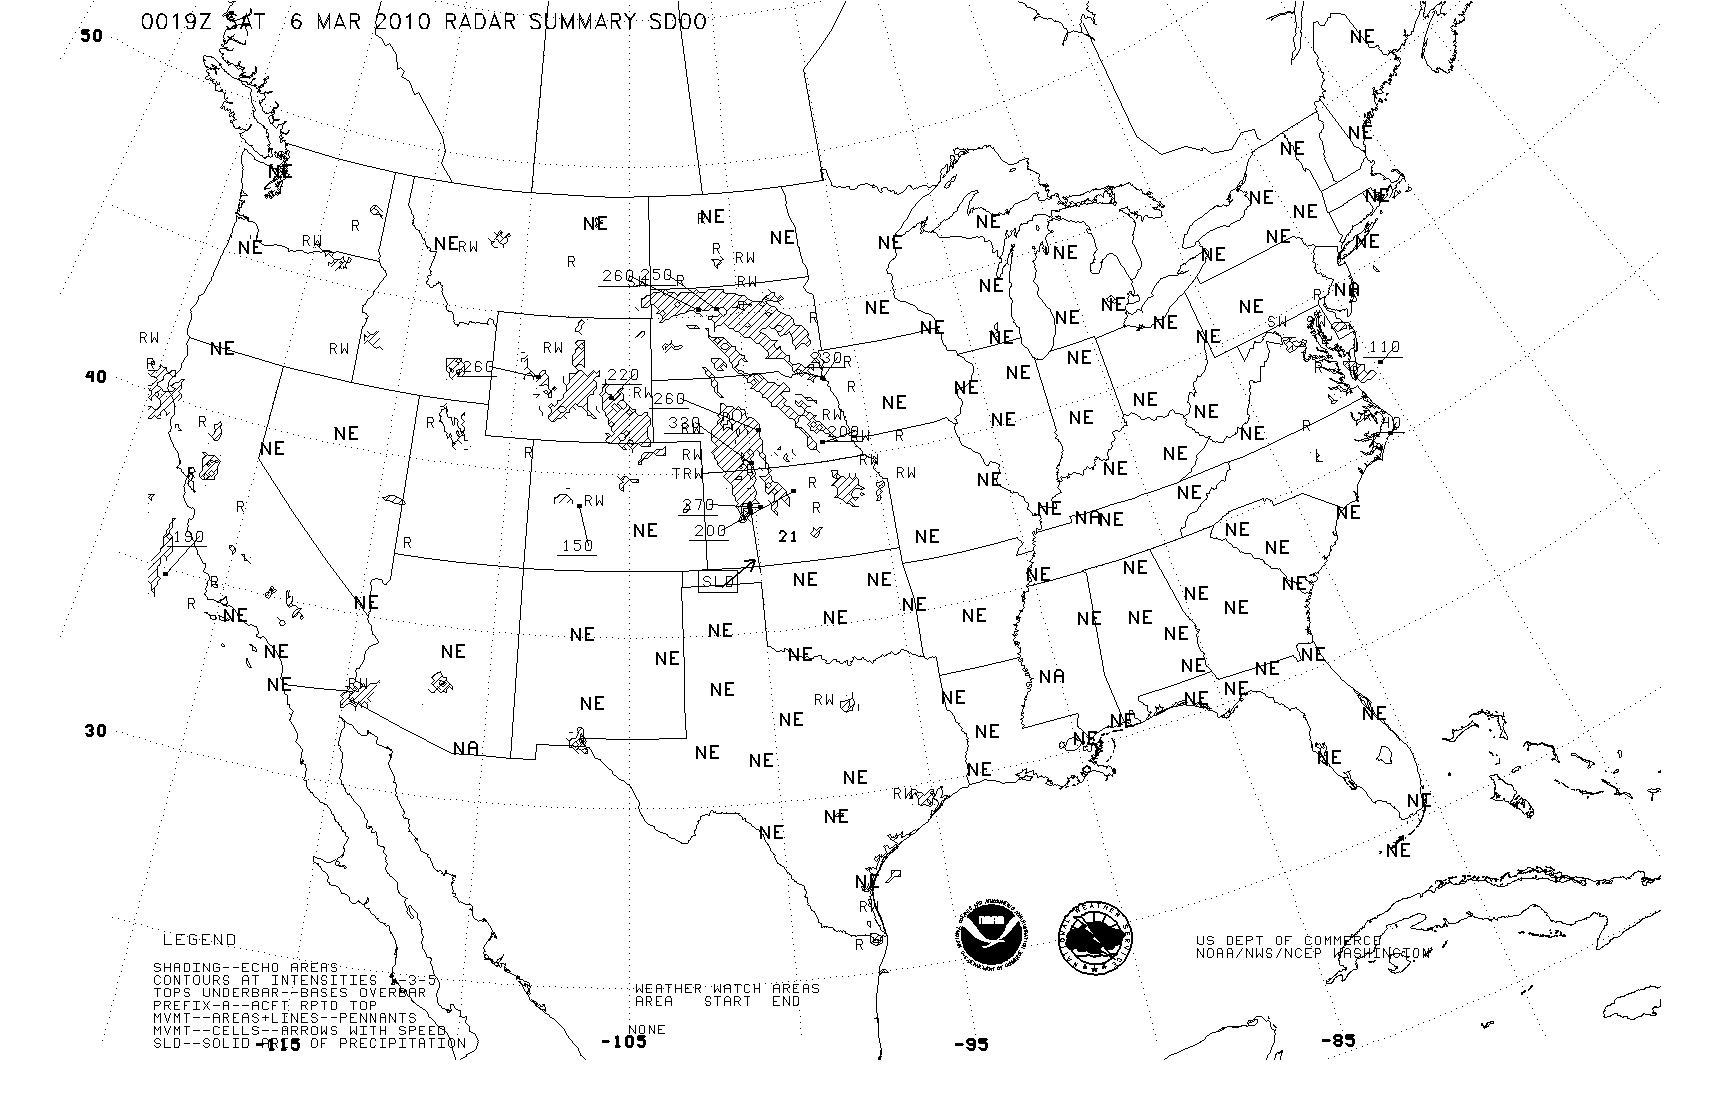
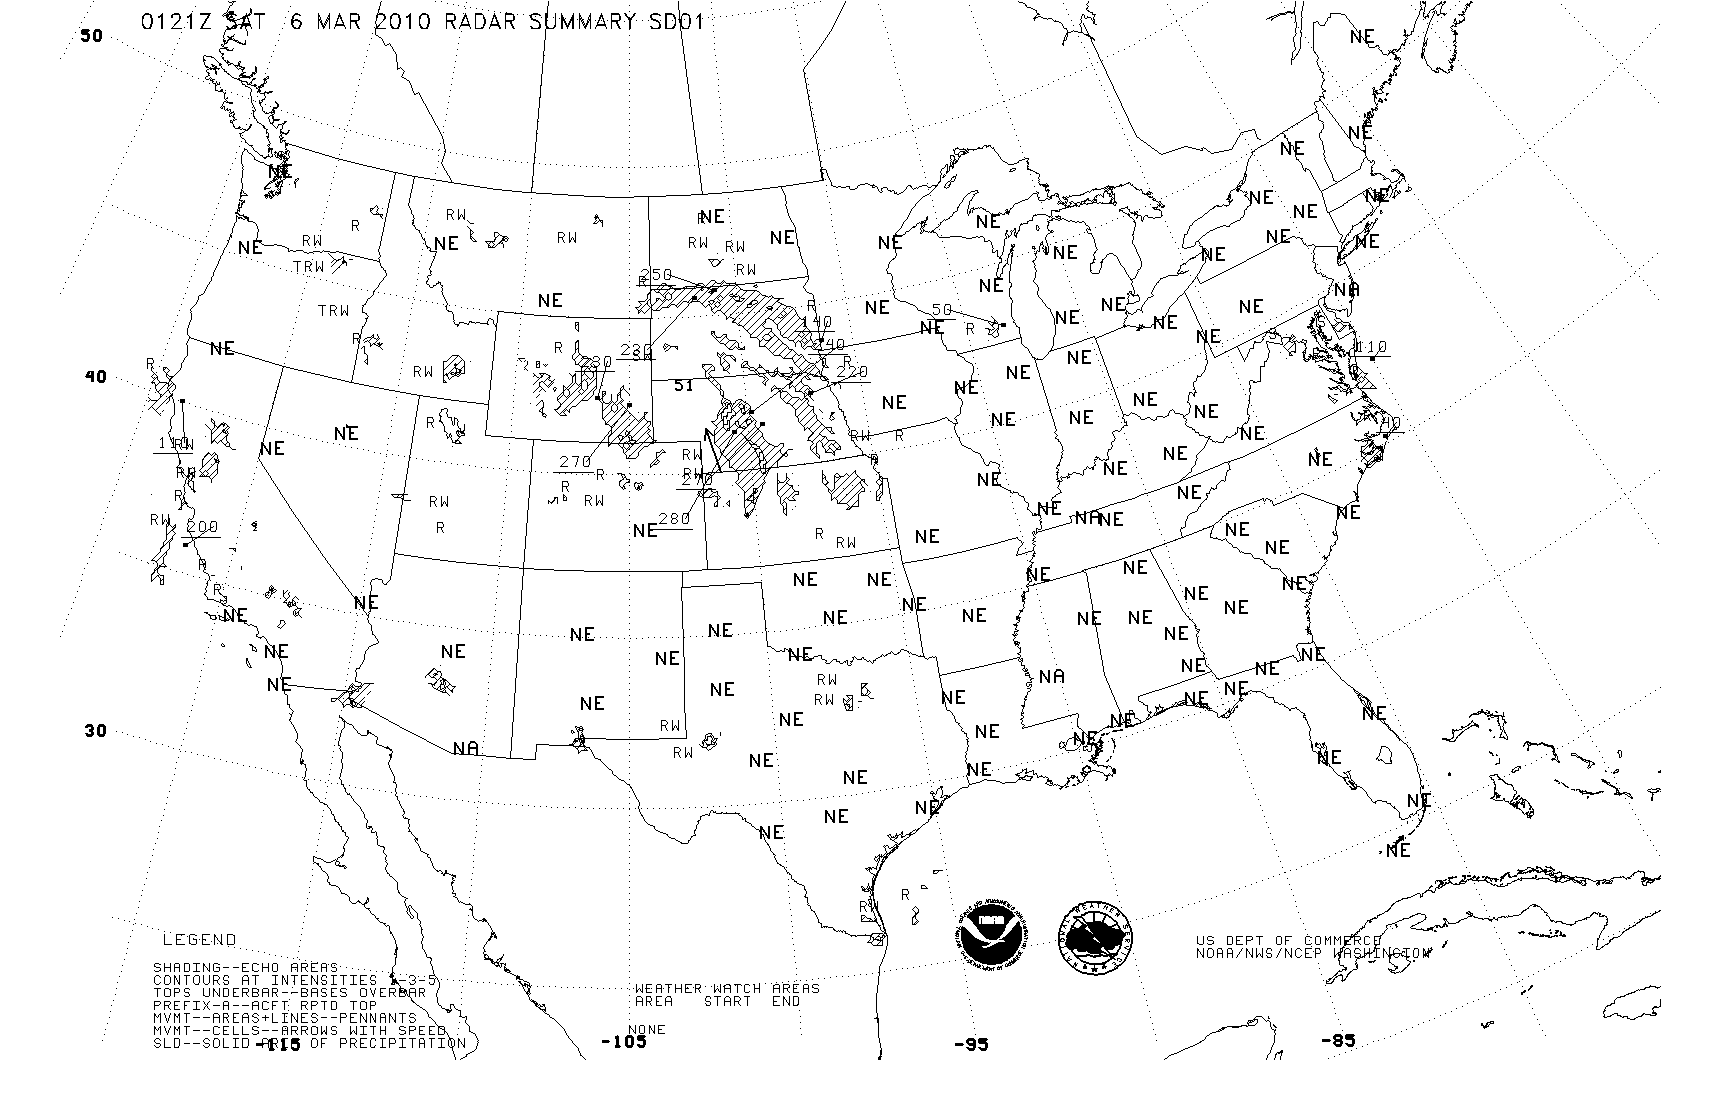
For a current chart: http://aviationweather.gov/data/iffdp/2020.gif
1. What does the box with “SLD” represent in southern CA?
2. Reference the 0121z chart. What is the significance of the second contour level in Nebraska?
3. What is the time and altitude of the highest echo tops?
4. Reference the 0121z chart. What is the direction and speed of the cell in Nebraska?
For a current chart: http://aviationweather.gov/data/iffdp/2080.gif

1. On the 12hr forecast what type of precip is forecasted for southern British Columbia?
2. What is the purpose of the thick green lines?
3. On the 12hr forecast what does the shading just east of the Low in Iowa represent?
4. View the chart sequence. When is the cold front predicted to pass through WA?
5. What is the forecasted precipitation after cold frontal passage in WA?
6. On the 12hr chart. What does the dashed line running through OR, CA and NV represent?
7. On the 48hr forecast, what does the bold dashed grey line running over Moses Lake represent?
For a current chart: http://aviationweather.gov/adds/progs/
1. What type of chart is below?
2. What is the yellow outlined area in the New England states indicate?
3. What is the vertical extent for the yellow outlined area (top and base)?
4. What does the blue zigzag line indicate?
5. What type of precip is forecasted for WA ahead of the cold front?
6. Does that agree with the Short Range Surface Prog charts above?
7. What ceilings and visibilities are forecasted for the Dakota’s?
For a current chart: http://aviationweather.gov/products/swl/
1. What type of chart is below?
2. What is the strongest wind speed shown for the subtropical jet?
3. What do the vertical hash marks indicate?
4. What is the purpose of the red scalloped area over the Great Lakes region?
For a current chart: http://aviationweather.gov/products/swm/
1. Over what state does the highest probability of icing occur?
2. What is meant by 75% probability?
For a current chart: http://aviationweather.gov/adds/icing/icing_nav.php?icg_type=CIP&height=max&fcst_hr=00
1. What do the white regions on this chart indicate?
2. What does the red hatching indicate?
For a current chart: http://aviationweather.gov/adds/icing/icing_nav.php?icg_type=CIPSEVO&height=max&fcst_hr=00